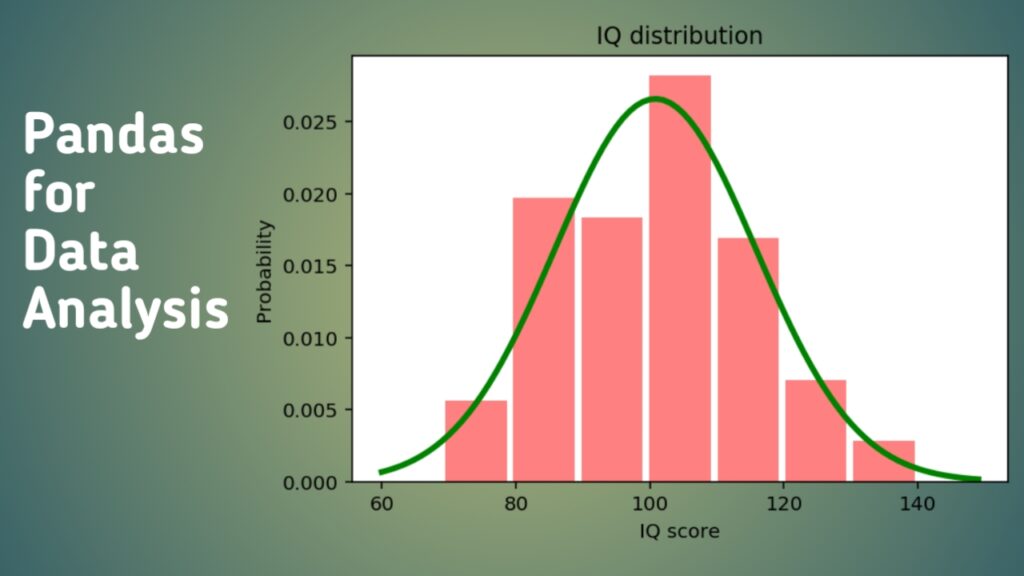
Data analysis is essential for making informed decisions in today’s data-driven world. The Python programming language is one of the most popular choices for data analysis, and among its many libraries, Pandas stands out as a powerful and flexible tool.
Whether you’re dealing with large datasets or just trying to clean up some messy data, Pandas can help you handle and process information efficiently.
In this article, we’ll explore how to use Pandas for data analysis, explaining its core concepts and common functions. We’ll walk through the basics and discuss practical examples to help you understand how this library can simplify your data tasks.
Table of Contents
ToggleWhat is Pandas?
Pandas is an open-source Python library designed for data manipulation and analysis. It offers data structures such as Series and DataFrames that make it easy to perform operations on structured data. This library is built on top of NumPy, allowing for fast and efficient data handling.
Originally developed for finance, Pandas has grown to support a wide range of applications, making it one of the go-to tools for data scientists, analysts, and developers who work with data.
Why Use Pandas for Data Analysis?
Pandas provides a high level of flexibility when it comes to data handling. Here are some reasons why it’s an excellent choice for data analysis:
Ease of Use: With simple syntax, you can perform complex data manipulations.
Data Cleaning: It provides tools for handling missing values and data inconsistencies.
Data Transformation: Pandas makes it easy to filter, sort, and aggregate data.
Integration: It works seamlessly with other Python libraries, such as Matplotlib for visualization and Scikit-learn for machine learning.
Setting Up Pandas
Before using Pandas, you’ll need to install it if you haven’t already. You can install Pandas via pip:
pip install pandas
Once installed, you can start by importing Pandas in your Python script:
import pandas as pd
Understanding Pandas Data Structures
Pandas has two primary data structures:
Series: A one-dimensional array-like structure that can hold any data type. It’s similar to a column in a spreadsheet.
DataFrame: A two-dimensional table, much like a spreadsheet, where data is aligned in rows and columns. This is the most commonly used data structure in Pandas.
Creating a Pandas DataFrame
To understand the basics of working with DataFrames, let’s start by creating one:
import pandas as pd
data = { 'Name': ['Alice', 'Bob', 'Charlie'], 'Age': [25, 30, 35], 'City': ['New York', 'Los Angeles', 'Chicago']}
df = pd.DataFrame(data)
print(df)
The output will look like this:
| Name | Age | City |
| Alice | 25 | NewYork |
| Bob | 30 | Los Angeles |
Reading Data into a DataFrame
Pandas can read data from various file formats, including CSV, Excel, JSON, and SQL databases. The most common format is CSV, and it can be read using the read_csv() function:
df = pd.read_csv(‘data.csv’)
This function reads the CSV file and loads it into a DataFrame. Similarly, you can use functions like read_excel(), read_json(), and read_sql() for other formats.
Data Inspection
To understand the data you’re working with, it’s essential to inspect it. Pandas provides several functions to do this:
head(): Displays the first few rows of the DataFrame.print(df.head())
info(): Provides a summary of the DataFrame, including data types and non-null values.print(df.info())
describe(): Gives statistical details, like mean, standard deviation, and percentiles.print(df.describe())
Data Cleaning with Pandas
In data analysis, cleaning is crucial for obtaining reliable results. Pandas provides various functions for this:Handling Missing Values:
Use dropna() to remove rows with missing values, or fillna() to replace them with a specific value.df.dropna() # Removes rows with missing valuesdf.fillna(0) # Replaces missing values with 0Renaming Columns: Use the rename() function to change column names.
df.rename(columns={‘OldName’: ‘NewName’}, inplace=True)
Data Transformation
Transforming data involves reshaping or modifying it for analysis. With Pandas, you can easily sort, filter, and group data.
Filtering Data: You can filter rows based on specific conditions.
filtered_df = df[df[‘Age’] > 25]
Sorting Data: Use the sort_values() function to sort the DataFrame.
df_sorted = df.sort_values(by=’Age’, ascending=False)
Grouping Data: To aggregate data based on certain criteria, you can use
groupby().grouped_df = df.groupby(‘City’).mean()
Working with Dates and Times
Handling time-based data is often necessary in data analysis. Pandas provides functionality to work with date and time data easily.
Converting to DateTime: Use pd.to_datetime() to convert a column to a datetime
object.df[‘Date’] = pd.to_datetime(df[‘Date’])
Date-Based Indexing: You can filter data based on dates or even resample it to different time frequencies.
df.set_index(‘Date’, inplace=True)
monthly_data = df.resample(‘M’).mean()
Data Visualization with Pandas
Although Pandas is not a visualization library, it integrates well with Matplotlib, allowing you to create basic plots.
Plotting a Simple Line Chart:
df.plot(x=’Date’, y=’Value’)
Bar Plot:
df[‘Category’].value_counts().plot(kind=’bar’)
Exporting Data from Pandas
After analyzing and processing the data, you may want to export it for reporting or further use. Pandas supports exporting data to various formats:
To CSV: Use to_csv() to save the DataFrame as a CSV file.
df.to_csv(‘output.csv’, index=False)
To Excel: Use to_excel() to export the DataFrame to an Excel file.
df.to_excel(‘output.xlsx’, index=False)
Common Pitfalls and Best Practices
While Pandas is powerful, there are some common pitfalls that beginners should avoid:Not Using Vectorized Operations: Using loops can be slow; Pandas functions are optimized for vectorized operations.
Ignoring Data Types: Always check data types to ensure accurate calculations.
Not Handling Missing Data Properly: Always clean your data before analysis to avoid misleading results.
Conclusion
Pandas is an incredibly versatile library that simplifies data analysis in Python. Whether you need to clean, transform, or visualize data, Pandas provides all the tools to do so effectively. By mastering the basics covered here, you can start exploring more advanced features and handle larger datasets confidently.With the growing demand for data analysis skills, learning how to use Pandas can significantly enhance your capabilities in data science, making your tasks easier and your results more reliable.


